

The Profit Margin Calculator is an essential tool for businesses and individuals. It enables you to swiftly and accurately determine the profitability of your products or services. This profit calculator simplifies the process of understanding financial health by analyzing the relationship between costs, sales prices, and profits.
Profit Margin Calculator
Grasping your profit margins is crucial for making informed, strategic decisions about your sales efforts.
- Reverse Sales Tax Calculator
- Return on Marketing Investment Calculator
- Wine Profit Calculator
- Depop Fee Calculator
- Savings Rate Calculator
Report an issue
Spotted a wrong result, broken field, or typo? Tell us below and we’ll fix it fast.
How to Use the Profit Margin Calculator
Using the Profit Margin Calculator is straightforward. First, input the sale price or revenue of your product or service. Next, enter the cost associated with producing or acquiring the product. After filling in these two fields, click the ‘Calculate’ button. The calculator will then display your profit margin as a percentage, illustrating the proportion of revenue that translates into profit.
Here are the simplified and structured instructions for using the Profit Margin Calculator: (tariffs check how)
- Enter Sale Price/Revenue: Input the sale price or revenue of your product or service.
- Input Cost: Enter the cost associated with producing or acquiring your product.
- Calculate: Click the ‘Calculate’ button.
- View Profit Margin: The calculator will display your profit margin as a percentage, showing the proportion of revenue that is profit.

Look into Profit Margin Calculator Formula
The Profit Margin formula is a simple yet powerful tool in financial analysis. It is calculated as:
Profit Margin = (Gross Profit / Revenue) × 100
Where:
Gross Profitis the difference between revenue and cost, representing the basic profitability before accounting for certain expenses.Revenueis the total sales or price of an item.
This formula helps in understanding how much of every dollar in sales contributes to the profit, indicating the efficiency of your business operations.
Step-by-Step Guide to Calculating Profit Margin
- Identify Sale Price/Revenue: For instance, if you’re selling a product for $30, this is your revenue.
- Identify Cost: Suppose the cost to produce this product is $9.
- Calculate Net Profit: Subtract the cost from the sale price. Here, $30 – $9 = $21.
- Divide Net Profit by Sale Price: $21 / $30 = 0.7.
- Convert to Percentage: Multiply by 100 to get a percentage. So, 0.7 * 100 = 70%. Thus, your profit margin is 70%.
Definition and Background of Profit Margin Calculator
Profit Margin, a key financial metric, measures the degree to which a company or a business activity makes money. It represents what percentage of sales has turned into profits. Essentially, it’s a measure of the effectiveness of a company in turning sales into profits.
Understanding profit margins is crucial for assessing the financial health and long-term viability of a business. Different industries have varying average profit margins, influenced by factors like market demand, production costs, and competition. Higher profit margins indicate a more profitable company that has better control over its costs compared to its competitors.
Understanding the key financial concepts of margin and markup, as well as gross and net profit, is crucial for businesses to evaluate their financial health and pricing strategies. Here’s an exploration of these concepts:
Margin vs. Markup
- Margin refers to the profit expressed as a percentage of the sale price. For instance, selling an item for $100 that cost $80 to produce results in a $20 profit. This $20 is 20% of the sale price, hence a 20% margin.
- Markup, on the other hand, is the profit expressed as a percentage of the cost. Using the same example, the $20 profit is 25% of the $80 cost, indicating a 25% markup.
While margin gives insight into profitability relative to sales price, markup focuses on the relationship between profit and cost.
Gross Profit vs. Net Profit
- Gross Profit: This is calculated by subtracting the direct costs of producing goods or providing services from the sales revenue. It does not include other expenses.
- Net Profit: More comprehensive, net profit subtracts all expenses, including operating costs, interest, taxes, etc., from the sales revenue.
Net profit gives a more complete picture of a company’s financial health by considering all costs, not just direct ones.
What is a Good Profit Margin?
- A “good” profit margin can vary widely by industry and business size. Generally, margins above 10-20% are considered healthy. However, it’s important to benchmark against industry norms and competitors for a more accurate assessment.
Calculating Margin in Excel and Google Sheets
- In Excel:
- Enter revenue in cell A1.
- Input cost of goods sold in cell B1.
- Use formula =(A1-B1)/A1 in cell C1 for margin ratio.
- Format cell C1 as a percentage for the margin percentage.
- In Google Sheets:
- The process mirrors Excel, with the same cell placements and formula.
Calculating Specific Profit Margins
- For a 10% Margin: Set your revenue to be the cost divided by (1 – 0.10).
- For a 20% Margin: Use Revenue = Cost / (1 – 0.20).
- For a 30% Margin: Apply Revenue = Cost / (1 – 0.30).
Understanding an 80% Margin with Profit Margin Calculator
- An 80% margin implies that 80% of the selling price is profit, while the remaining 20% covers the costs. It’s a high-margin scenario indicating significant profitability relative to costs.
Understanding these financial metrics is key for businesses to set appropriate pricing, manage costs effectively, and assess overall financial performance.
Table of Example Calculations for Profit Margin
| Sale Price | Cost | Profit Margin (%) |
|---|---|---|
| $50 | $20 | 60% |
| $100 | $55 | 45% |
| $200 | $150 | 25% |
These examples show different scenarios of sale prices and costs. The profit margin decreases as the cost constitutes a higher percentage of the sale price, illustrating the importance of managing costs to maintain a healthy profit margin.
Consulting a table of example calculations for profit margin can provide a clear and practical understanding of how these figures are derived. Below is a simplified table with examples to illustrate the calculation of both gross and net profit margins:
| Example | Revenue | Cost of Goods Sold (COGS) | Operating Expenses | Net Income | Gross Profit Margin (%) | Net Profit Margin (%) |
|---|---|---|---|---|---|---|
| Company X | $200,000 | $120,000 | $30,000 | $50,000 | 40% | 25% |
| Company Y | $500,000 | $300,000 | $100,000 | $100,000 | 40% | 20% |
| Company Z | $1,000,000 | $700,000 | $150,000 | $150,000 | 30% | 15% |
Explanation of the Table:
- Revenue: This is the total amount of money earned from sales before any deductions.
- Cost of Goods Sold (COGS): This represents the direct costs attributable to the production of the goods sold in a company.
- Operating Expenses: These are the costs required to run the company that are not directly tied to the production of the goods or services (e.g., rent, utilities, insurance).
- Net Income: This is the profit after all expenses (COGS, operating expenses, taxes, etc.) have been deducted from total revenue.
- Gross Profit Margin (%): Calculated as ((text{Revenue} – text{COGS}) / text{Revenue}) × 100. It represents what percentage of sales has turned into profits before accounting for certain expenses like taxes and interest.
- Net Profit Margin (%): Calculated as (text{Net Income} / text{Revenue}) × 100. This shows what percentage of sales is left as profit after all expenses.
Example Calculations:
- For Company X:
- Gross Profit Margin = (($200,000 – $120,000) / $200,000) × 100 = 40%
- Net Profit Margin = ($50,000 / $200,000) × 100 = 25%
- For Company Y:
- Gross Profit Margin = (($500,000 – $300,000) / $500,000) × 100 = 40%
- Net Profit Margin = ($100,000 / $500,000) × 100 = 20%
- For Company Z:
- Gross Profit Margin = (($1,000,000 – $700,000) / $1,000,000) × 100 = 30%
- Net Profit Margin = ($150,000 / $1,000,000) × 100 = 15%
These calculations provide insights into how efficiently a company is operating and its ability to turn sales into profit. The higher the percentage, the more efficient and profitable the company is considered to be. For more detailed explanations and examples, you can refer to resources like Fundera or HubSpot.
Profitability Chart illustrating the profit Margins
Here is a chart illustrating the profit margins of different companies. Each company is shown with its respective profit margin percentage. The chart also includes reference lines to indicate what might be considered healthy, moderate, and low profit margins:
- Healthy Margin (20% and above): Typically considered a strong profit margin.
- Moderate Margin (10% to 20%): Represents a fair profit margin.
- Low Margin (below 10%): Indicates a relatively low profit margin.
This visual representation helps in quickly assessing how each company stands in terms of profitability.
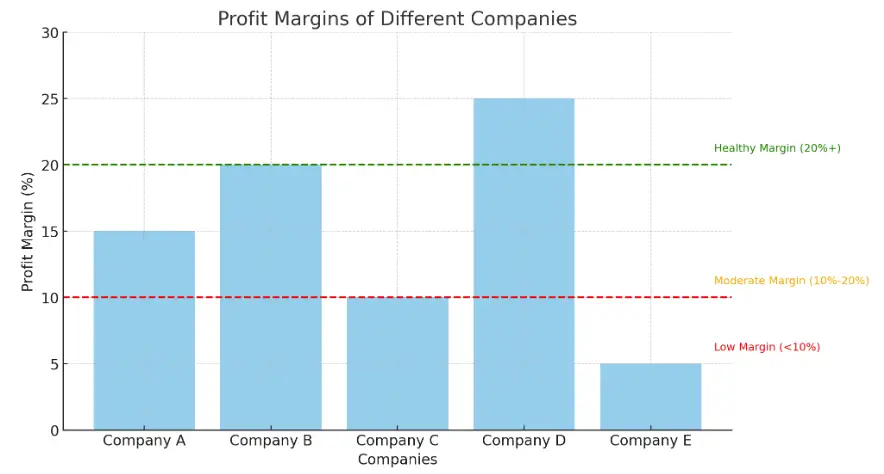
Certainly! This chart provides a visual representation of profit margins for five different companies, labeled as Company A through E. The profit margin, expressed as a percentage, measures how much of each dollar in sales a company keeps as profit after accounting for costs.
Profit Margin Calculator Elements of the Chart:
- Vertical Bars: Each bar represents a different company. The height of the bar corresponds to the profit margin percentage of that company.
- Horizontal Axis (X-Axis): This axis lists the companies being compared – Company A, B, C, D, and E.
- Vertical Axis (Y-Axis): This axis shows the profit margin percentage. It ranges from 0% to 30%, providing a scale for comparison.
- Color of Bars: The bars are colored sky blue for easy visual differentiation.
- Reference Lines: There are horizontal dashed lines at the 10% and 20% marks, colored in red and green, respectively. These lines serve as benchmarks to categorize the profit margins:
- Red Line: Represents a 10% profit margin. Margins below this line are considered low.
- Green Line: Represents a 20% profit margin. Margins above this line are considered healthy.
Analysis of Each Company’s Profit Margin:
- Company A: Has a profit margin of 15%. This is above the red line but below the green line, indicating a moderate profit margin.
- Company B: Exhibits a 20% profit margin, which is right at the green line. This is typically considered a healthy profit margin.
- Company C: Shows a profit margin of 10%, which is at the threshold of the red line, indicating the lower end of a moderate profit margin.
- Company D: Has the highest profit margin among the group at 25%, well above the green line, signifying a very healthy profit margin.
- Company E: With a 5% profit margin, it falls below the red line, indicating a low profit margin compared to the others.
This chart is an effective tool for quickly comparing the profitability of different companies. A higher profit margin implies better efficiency in converting sales into actual profit. However, it’s important to note that what is considered a “good” profit margin can vary significantly by industry.
Glossary for Profit Margin Calculator
- Revenue: Total sales or price of an item.
- Price: The price of a single item.
- Cost: The expenditure to produce an item(s).
- Cost of Goods Sold (COGS): A formal term for cost, representing direct costs attributable to goods produced and sold.
- Margin: The ratio of profit to revenue.
- Gross Profit: Profits before subtracting manufacturing or operating costs.
- Net Profit: Profit after subtracting manufacturing or operating costs.
- Markup: The percentage added to the cost to determine the selling price.
Frequently Asked Questions (FAQs)
- What is a good profit margin? A good profit margin varies by industry, but a higher margin typically indicates better financial health and efficiency.
- Is a higher profit margin always better? Generally, yes. However, excessively high margins in competitive markets may attract new competitors.
- How can I improve my profit margin? Improving profit margins can be achieved by increasing prices, reducing costs, or optimizing operational efficiency.
- Does a high profit margin mean high cash flow? Not necessarily. Profit margin is a profitability ratio, whereas cash flow measures the actual cash incoming and outgoing.
- Can a business have a high profit margin but still fail? Yes, if the high profit margin is not accompanied by adequate sales volume or proper cash flow management.
Additional Reading Sources about Profit Margin Calculator
If you’re looking to deepen your understanding of profit margins, there are several comprehensive resources available online:
- “How to Calculate Profit Margins: A Straightforward Guide for Businesses” by Brandafy offers a thorough explanation of profit margins, including the formulas for calculating net profit margin. The guide also delves into real-world applications across various industries, such as retail, service-based, and manufacturing businesses. It emphasizes the importance of understanding industry benchmarks and standards for profit margins and shares strategies for improving them. The article can be a useful resource for grasping the nuances of profit margins in different business contexts Brandafy.com.
- HubSpot’s “Profit Margin, Gross Margin, and Net Profit Margin: A Quick Guide” breaks down the different formulas needed to calculate profit margin, gross margin, and net profit margins. It also provides examples and explains how these calculations can be applied to real-world scenarios. This guide is beneficial for those who prefer a more formulaic and example-driven approach to understanding profit margins HubSpot.com.
- Appy Pie’s “Navigating Profit Margins: The Business Owner’s Roadmap to Success” discusses the significance of leveraging technology and tools to enhance profit margins. It outlines steps to calculate gross and net profit margins and provides key strategies for increasing profit margins. This resource is particularly useful for those interested in integrating technology to improve business profitability AppyPie.com.
- Fundera’s “Profit Margins: Definition, Formula, How to Calculate” offers a detailed explanation of profit margins, including the types of profit margins (gross and net) and how to calculate them. This guide is beneficial for gaining a comprehensive understanding of the concept and its application in business finance management Fundera.com.
- “How to successfully calculate profit margin” by Block Advisors provides a clear outline of how to calculate the profit margin percentage for different metrics, including gross, operating, and net margins, with the help of an example. It also discusses the implications of high vs. low-profit margins and steps to grow profit margins, making it a practical guide for businesses aiming to enhance their profitability BlockAdvisors.com.
These resources collectively offer a robust understanding of profit margins, covering theoretical concepts, practical calculations, and strategies for improvement, making them ideal for business owners, financial analysts, and anyone interested in the financial aspects of running a business. (lead value estimate)