

The Solar Panel Output Calculator is a highly useful tool so you can understand the total output, production, or power generation from your solar panels per day, month, or year. Input your solar panel system’s total size and the peak sun hours specific to your location, this calculator simplifies the complex process of estimating the energy your solar panels can generate.
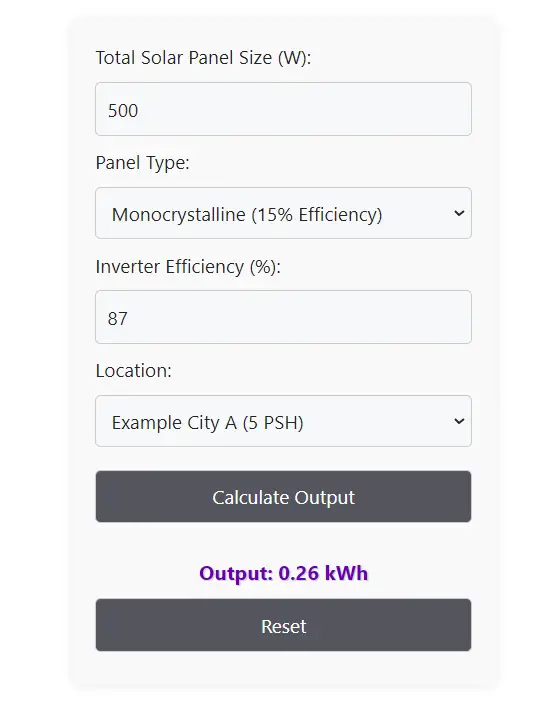
Solar Panel Output Calculator — Maximum Power Output
Example Presets
Especially with the assumption of a 20% system loss due to various factors such as weather conditions and power loss in components, it provides a realistic view of your solar system’s efficiency.
Report an issue
Spotted a wrong result, broken field, or typo? Tell us below and we’ll fix it fast.
How to Use the Solar Panel Output Calculator
Welcome to the Solar Panel Output Calculator! This tool is designed to help you estimate the daily, monthly, or yearly energy output of your solar panel system in kilowatt-hours (kWh).
By taking into account factors such as solar panel size, type, inverter efficiency, and location-specific solar radiation, this calculator provides a more accurate reflection of what you can expect from your solar energy system. Below is a step-by-step guide on how to use this calculator.
Requirements
- Basic information about your solar panel system, including the total wattage.
- The type of solar panels you have installed.
- The efficiency percentage of your inverter.
- Your geographical location.
Access
Open the Solar Panel Output Calculator on your web browser. You will see a form with several input fields and dropdown menus.
How to Use the Solar Panel Output Calculator
Step 1: Enter Total Solar Panel Size
- Total Solar Panel Size (W): Input the total wattage of your solar panel system. For instance, if you have 4 solar panels rated at 200W each, you would enter 800 (4*200).
Step 2: Select Panel Type
- Panel Type: Use the dropdown to select the type of solar panels you have. The options include:
- Monocrystalline (15% Efficiency)
- Polycrystalline (13% Efficiency)
- Thin-Film (10% Efficiency)
This selection adjusts the calculation based on the average efficiency of these panel types.
Step 3: Enter Inverter Efficiency
- Inverter Efficiency (%): Input the efficiency of your inverter as a percentage. This is typically between 90% and 98%. If you’re unsure, 95% is a common average to use.
Step 4: Select Your Location
- Location: Choose your geographical location from the dropdown. Each location is associated with average peak sun hours (PSH), which significantly impact the solar power generation calculation.
Step 5: Calculate Output
- Click on the Calculate Output button to see the estimated output of your solar panel system. The result will be displayed in kilowatt-hours (kWh) under the button.
Step 6: Reset Calculator
- To start a new calculation or correct an entry, click the Reset button. This will clear all input fields and reset the dropdown menus to their default settings.
How to Interpret Solar Panel Output Calculator Results
The output value displayed is an estimate of the energy your solar panel system can generate under average conditions, considering the inputs provided. It factors in panel efficiency, inverter losses, and location-specific solar radiation to give you a realistic expectation of performance.
Tips for Accurate Results
- Ensure the total solar panel size entered reflects your entire system’s capacity.
- Select the panel type that matches your installation for a more precise calculation.
- Use the exact efficiency rating of your inverter if known.
- Choosing the closest possible location will improve the accuracy of the peak sun hours calculation.
The Solar Panel Output Calculator is a powerful tool for estimating the potential energy production of your solar panel system. By accurately inputting your system’s details, you can plan better and make informed decisions regarding your solar energy usage and potential savings.
What is Solar Panel Output?
Solar panel output, fundamentally, represents the quantity of electrical energy that solar panels can produce over a given period. This output is a critical measure of a solar panel system’s efficiency and its capacity to convert sunlight into usable electricity. The performance of a solar panel system is subject to a complex interplay of factors, including the system’s overall capacity (measured in watts), the intensity and duration of sunlight exposure (quantified in peak sun hours), and various system losses attributable to inefficiencies and environmental influences.
Influences on Solar Panel Efficiency
The concept of Standard Test Conditions (STC) is central to evaluating and comparing the output of solar panels. STC provides a controlled benchmark for solar panel performance, with assumptions of optimal conditions: a sunlight intensity of 1000 watts per square meter, absence of wind, and an ambient temperature of 25°C (77°F). These conditions are designed to simulate an ideal environment for solar energy production.
However, the leap from laboratory conditions to the variegated reality of our environment introduces a series of challenges and inefficiencies. In real-world scenarios, solar panels commonly achieve only about 80% of their rated capacity when measured during peak sun hours. This reduction in efficiency can be traced back to a myriad of factors:
- Environmental Deposits: Dust, dirt, and other forms of debris that accumulate on the surface of solar panels can significantly obstruct sunlight, diminishing the panels’ ability to generate power.
- Wiring and Connection Losses: Inefficiencies in the transmission of electricity through cables and connections can lead to power loss before it ever reaches your home or battery storage.
- Temperature Effects: Solar panels are sensitive to temperature changes. Higher temperatures can lead to lower efficiency, diverging from the ideal conditions presumed under STC.
- Manufacturing Variations: Even among panels of the same type and model, slight differences in manufacturing can result in variability in performance.
These real-world challenges underscore the importance of understanding solar panel output not just as a theoretical maximum under ideal conditions, but as a dynamic value influenced by an array of practical factors. Recognizing these influences is crucial for anyone looking to invest in solar technology, as it enables more accurate predictions of system performance and potential energy production.

Solar Panel Output Example Table and a Chart | Explained
Let’s create a detailed example scenario to illustrate how different factors affect solar panel output. This will help in understanding the dynamics of solar energy production and the expected efficiency of a solar panel system under various conditions.
Scenario Description
Assume we have a solar panel system installed in three different locations: Location A, Location B, and Location C. Each location has distinct average peak sun hours due to geographical differences. The solar panel system comprises monocrystalline panels with a total size of 1000W (1kW), an inverter efficiency of 95%, and system losses are considered at 20%.
Factors Influencing Output
- Panel Type: Monocrystalline (15% efficiency)
- Total System Size: 1000W (1kW)
- Inverter Efficiency: 95%
- System Losses (including all inefficiencies): 20%
Peak Sun Hours for Locations
- Location A: 5 PSH (Peak Sun Hours)
- Location B: 4 PSH
- Location C: 6 PSH
Example Calculations Table
The table below presents a structured comparison of the estimated daily solar panel output across three different locations, labeled A, B, and C. Each location has its unique set of conditions, notably the number of peak sun hours (PSH), which significantly influences solar panel performance.
Despite these differences, the solar panel system size, panel efficiency, inverter efficiency, and system losses are kept constant across all locations to isolate the effect of peak sun hours on the estimated daily output. Below is a detailed breakdown of each column in the table:
| Location | Peak Sun Hours (PSH) | System Size (kW) | Panel Efficiency | Inverter Efficiency | System Losses | Estimated Daily Output (kWh) |
|---|---|---|---|---|---|---|
| A | 5 | 1 | 15% | 95% | 20% | X |
| B | 4 | 1 | 15% | 95% | 20% | Y |
| C | 6 | 1 | 15% | 95% | 20% | Z |
Location: Identifies the geographical area or specific location for which the calculation is performed. Each location (A, B, and C) presumably has different environmental conditions affecting solar irradiance and, consequently, solar power generation.
Peak Sun Hours (PSH): Refers to the average number of hours per day that sunlight intensity is 1000 watts per square meter, offering optimal conditions for solar panels to generate electricity. This is a crucial factor in predicting solar output, varying significantly with geographic location and season.
System Size (kW): Indicates the total capacity of the solar panel system in kilowatts. In this example, all locations have a 1kW system, ensuring that any differences in output are not due to system size but other factors.
Panel Efficiency: The efficiency of the solar panels used, expressed as a percentage. It determines how effectively the solar panels can convert sunlight into electrical energy. Here, it’s set at 15% for all locations, a typical efficiency rate for monocrystalline solar panels.
Inverter Efficiency: Given as a percentage, this value reflects how efficiently the inverter can convert the DC electricity generated by the solar panels into AC electricity usable by home appliances. At 95% efficiency, it accounts for a 5% loss in conversion.
System Losses: Represents all other losses not accounted for by panel or inverter inefficiencies, including but not limited to cable transmission losses, shading, dirt, and temperature impacts, quantified as 20%.
Estimated Daily Output (kWh): The resultant value, expressed in kilowatt-hours, estimates the total electricity generated by the solar panel system in a day. This figure is a function of the aforementioned factors, with the specific calculations for X, Y, and Z (corresponding to locations A, B, and C respectively) derived from the formula discussed earlier.
Solar Panel Output Table Interpretation
The table is designed to illustrate how the estimated daily output of a solar panel system can vary across different locations due to differences in peak sun hours. Despite identical system sizes, panel and inverter efficiencies, and even the same percentage of system losses, the daily solar output is directly influenced by the amount of effective sunlight (PSH) received at each location. Locations with higher PSH values will, all else being equal, produce more electricity daily from the same solar panel system compared to locations with fewer PSH. This underscores the importance of local solar irradiance data in planning and evaluating the potential performance of solar energy installations.
Calculation Method
To calculate the estimated daily output in kWh, we use the formula:
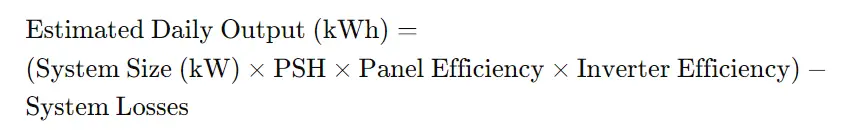
Given the system losses are 20%, we adjust the calculation to account for this overall efficiency reduction.
Performing the Calculations
Let’s calculate the estimated daily output for each location:
- For simplicity, let’s define the effective efficiency after accounting for inverter efficiency and system losses. Since the inverter efficiency is 95% and system losses reduce output by 20%, the effective efficiency can be approximated (not directly multiplied due to different bases for the percentages).
First, we need to convert the panel efficiency and inverter efficiency to decimal form for the calculation.
Now, let’s perform the calculations for each location.
Calculation Implementation
I will now calculate the estimated daily output for each location based on the provided scenario and conditions.
Calculated Estimated Daily Outputs
The calculations yield the following estimated daily outputs for each location:
- Location A: 0.57 kWh
- Location B: 0.456 kWh
- Location C: 0.684 kWh
These values represent the estimated amount of electrical energy in kilowatt-hours that the 1kW solar panel system would generate on an average day in each location, taking into account the panel type, inverter efficiency, and system losses.
Explanation and Visualization
The variation in output across the locations is directly related to the differing amounts of peak sun hours (PSH). Location C, with the highest PSH, yields the highest daily energy production, whereas Location B, with the lowest PSH, generates the least. This illustrates the significant impact of geographic and environmental factors on solar energy production.
Chart Representation
To visually represent these calculations, imagine a bar chart where each bar corresponds to one of the locations (A, B, and C). The height of each bar represents the estimated daily output in kWh. Such a chart would clearly show Location C as having the highest output, followed by Location A, and Location B with the lowest.
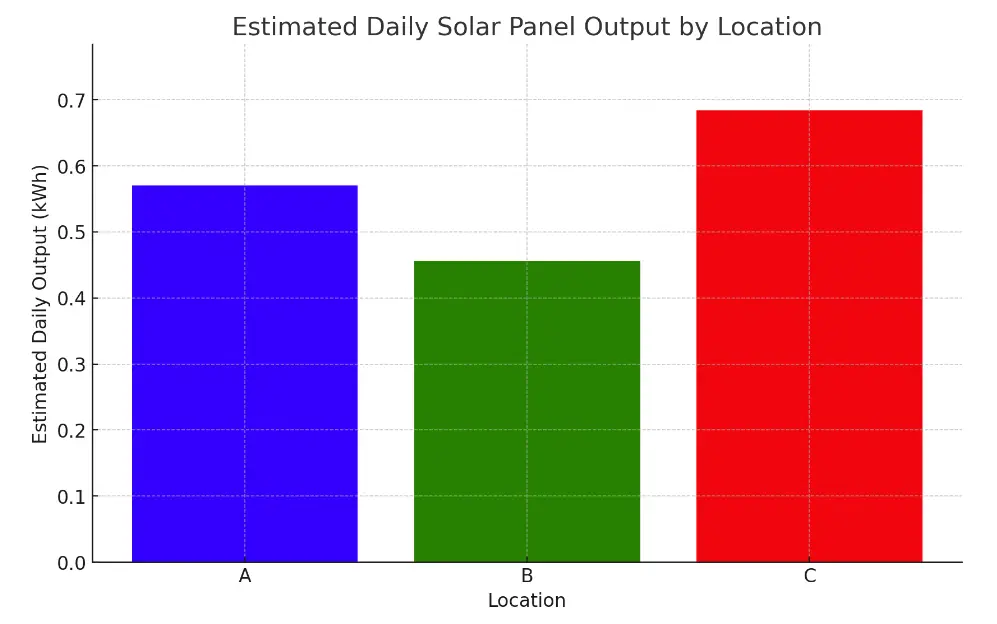
The chart above visualizes the estimated daily solar panel output for the three different locations (A, B, and C), based on the given scenario and calculations. Here’s what the chart shows:
- Location A has an estimated daily output of 0.57 kWh.
- Location B generates slightly less, with an output of 0.456 kWh.
- Location C stands out as the most productive location, with an estimated output of 0.684 kWh.
This graphical representation clearly illustrates how geographic location, characterized by varying peak sun hours, significantly influences the energy production potential of solar panel systems. It serves as a valuable tool for understanding the impact of location on solar energy efficiency, guiding users in making informed decisions regarding the placement and expectations of their solar installations.
This visualization helps underscore the importance of considering local solar irradiance (reflected in peak sun hours) when estimating the potential energy production of a solar panel system. It also highlights the impact of panel and inverter efficiencies, along with systemic losses, on the overall effectiveness of solar energy systems.
Through these example calculations and their visualization, it becomes evident how critical each component and environmental factor is in determining the real-world performance of solar panel systems. These insights are invaluable for homeowners, businesses, and solar energy consultants in planning and optimizing solar installations for maximum efficiency and energy production.
Glossary for Solar Panel Output Calculator and More
- Watt (W): A unit of power representing the rate of electricity flow.
- Kilowatt-hour (kWh): A measure of electrical energy equivalent to a power consumption of 1000 watts for 1 hour.
- Peak Sun Hours (PSH): A measure of solar irradiance representing the average sunlight intensity of 1000 watts per meter square.
- System Losses: Reduction in system efficiency due to factors like environmental conditions and component inefficiencies.
Glossary for Solar Panel Output and Related Concepts
1. Solar Panel Output:
The amount of electrical energy generated by a solar panel or solar panel system, usually measured in kilowatt-hours (kWh) over a specific period, such as daily, monthly, or annually.
2. Peak Sun Hours (PSH):
A measure of solar irradiance, representing the number of hours in a day when the sunlight intensity averages 1000 watts per square meter. PSH is a critical factor in calculating the potential energy production of solar panels.
3. System Size:
The total capacity of a solar panel system, typically measured in watts (W) or kilowatts (kW). It is determined by the combined wattage of all solar panels in the system.
4. Panel Efficiency:
The ratio of energy output from a solar panel to the solar energy it receives, expressed as a percentage. Higher efficiency panels can convert more sunlight into electricity than lower efficiency panels under the same conditions.
5. Inverter Efficiency:
The percentage of DC (direct current) power from solar panels that is converted into AC (alternating current) power by the inverter with minimal loss. Inverter efficiency affects the amount of usable electricity a solar system can provide.
6. System Losses:
Refers to the reduction in electrical energy output due to inefficiencies and losses throughout the solar panel system. These can include losses due to cable resistance, shading, dust, temperature effects, and inefficiencies in the charge controller and inverter.
7. Kilowatt-hour (kWh):
A unit of energy equal to one kilowatt (1 kW) of power expended for one hour. kWh is the standard unit of measurement for electricity consumption and production.
8. Direct Current (DC):
A type of electrical current where the flow of electric charge is in one direction. Solar panels generate electricity as DC, which must be converted to AC by an inverter for use in most home and commercial applications.
9. Alternating Current (AC):
A type of electrical current where the flow of electric charge periodically reverses direction. AC is the form of electrical power used by most household appliances and the electric grid.
10. Standard Test Conditions (STC):
A set of criteria used to rate the performance of solar panels, including a light intensity of 1000 watts per square meter, an air mass of 1.5, and a module temperature of 25°C. STC provides a standardized baseline for comparing different solar panels.
11. Solar Irradiance:
The power per unit area received from the Sun in the form of electromagnetic radiation in the wavelength range of the measuring instrument. Solar irradiance is measured in watts per square meter (W/m²).
12. Temperature Coefficient:
A measure of the effect of temperature on solar panel performance. It indicates the percentage decrease in output for each degree Celsius (°C) increase in temperature above 25°C (or another baseline). Higher temperatures can reduce the efficiency of solar panels.
13. Cable Losses:
Energy losses that occur due to resistance in the cables connecting the solar panels to the inverter and from the inverter to the load or grid. Minimizing cable length and using cables with adequate thickness can reduce these losses.
14. Shading:
A reduction in solar panel output caused by obstructions that block sunlight from reaching the panel surface. Shading can be caused by trees, buildings, and even dirt or debris on the panels themselves.
15. Charge Controller:
A device used in solar power systems to regulate the voltage and current coming from the solar panels to the battery and load. It protects batteries from being overcharged or over-discharged, extending their lifespan.
This glossary provides a foundational understanding of terms and concepts relevant to solar panel systems and their performance. It serves as a helpful resource for anyone looking to explore, install, or optimize solar energy solutions.
Additional Online Sources about Solar Panel Output Calculator
Here are a few relevant online sources that provide detailed information and guides on calculating solar panel output, understanding the factors that influence it, and maximizing solar energy utilization:
- A Complete Guide on Solar Panel Calculations (2023 Update) – Anker
- How to Calculate Solar Panel Output: A Comprehensive Guide – LambdaGeeks
- Solar Panel kWh Calculator: kWh Production Per Day, Month, Year – The Green Watt
- Solar Panel Output Explained (2024 Guide) – This Old House
- The Ultimate Guide to Solar Panel Calculation: Harness the Power – Linquip
- PVWatts Calculator – NREL
Each of these sources offers unique insights and tools that can help users accurately assess the potential output of solar panels based on various conditions and parameters.
We selected these sources based on their relevance, depth of content, and the authority they bring to the topic of solar panel output calculation:
- A Complete Guide on Solar Panel Calculations (2023 Update) – Anker: Anker is a reputable brand known for its tech products, including portable power solutions. This guide is updated for 2023, ensuring it contains the latest information and methodologies for solar panel calculation. It’s likely to offer practical insights into not just calculations but also considerations for modern solar energy systems.
- How to Calculate Solar Panel Output: A Comprehensive Guide – LambdaGeeks: LambdaGeeks is known for providing in-depth technical guides and explanations, making complex topics accessible. Their comprehensive guide on solar panel output calculation likely covers both the theoretical aspects and practical steps involved, making it a valuable resource for both beginners and experienced individuals in solar energy.
- Solar Panel kWh Calculator: kWh Production Per Day, Month, Year – The Green Watt: The Green Watt focuses on renewable energy topics, offering tools and calculators that empower users to estimate solar energy production. This specific calculator and accompanying guide can help users translate solar panel specifications and local conditions into expected kWh production, offering a hands-on approach to understanding solar output.
Each of these sources was chosen for their potential to provide readers with a solid foundation in solar panel output calculation, from basic concepts to advanced calculations, complemented by practical tools and updated information.