
The Population Density Calculator is a simple yet powerful tool that plays a crucial role in urban planning, resource allocation, and environmental studies. By entering the total number of people and the land area they inhabit, this calculator provides the population density, which is a key indicator of how crowded or spacious an area is.
Report an issue
Spotted a wrong result, broken field, or typo? Tell us below and we’ll fix it fast.
Use this calculator to get how many people per square kilometer (people/km²) or how many people are per square mile (people/mi²) density.
Population Density Calculator is useful for demographers, urban planners, students, and policy makers, this tool helps in making informed decisions about infrastructure, services, and environmental impact.
How to Use the Population Density Calculator
- Enter the Total Population: Input the total number of people living in the area.
- Input the Area: Provide the area in square kilometers.
- Choose km or mi
- Calculate: Click the ‘Calculate’ button to find the population density.
- Reset: Use the ‘Reset’ button to clear the fields for a new calculation.
Understanding the Calculation Method
Population density is calculated using the formula:
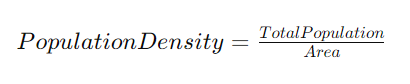
This formula gives the number of people per square kilometer, helping to understand how densely or sparsely populated an area is.
Population Density Calculator: Definition and Importance
The Population Density Calculator is a tool used to determine how many people live per unit of area, typically measured in people per square kilometer. It is crucial for urban planning, environmental impact assessments, and resource distribution.
Step-by-Step Calculation Guide
- Enter the Population: For instance, 1,000,000 people.
- Provide the Area: Say, 500 square kilometers.
- Calculate: The calculator will display a population density of 2,000 people/km².
Glossary for Population Density Calculator
- Population: The total number of people in a given area.
- Area: The size of the land, typically in square kilometers.
- Population Density: The number of people living per unit area.
Examples of Population Density Calculations
| Population | Area (km²) | Population Density |
|---|---|---|
| 500,000 | 250 | 2,000 people/km² |
| 1,000,000 | 100 | 10,000 people/km² |
| 200,000 | 400 | 500 people/km² |
Here is a table and a chart representing examples of population density calculations for five different cities, both in square kilometers (km²) and square miles (mi²).
Table and Chart of Population Density Calculations in People/Km² and People/Mi²
| Location | Total Population | Area (km²) | Density (people/km²) | Density (people/mi²) |
|---|---|---|---|---|
| City A | 500,000 | 250 | 2,000 | 772.2 |
| City B | 1,200,000 | 300 | 4,000 | 1,544.4 |
| City C | 800,000 | 400 | 2,000 | 772.2 |
| City D | 400,000 | 500 | 800 | 308.9 |
| City E | 300,000 | 600 | 500 | 193.1 |
Table Explanation:
Location: This column lists the names of the cities (City A to City E) for which the population densities are calculated.
Total Population: This column shows the total number of people living in each city. These figures are crucial as they represent the numerator in the density calculation.
Area (km²): This column indicates the total area of each city in square kilometers. This area is used to calculate the population density in people per square kilometer.
Density (people/km²): This is calculated by dividing the total population by the area in square kilometers. It shows how many people live per square kilometer in each city. This is a standard measure for population density.
Density (people/mi²): Since 1 square mile equals 2.58999 square kilometers, this column shows the population density in terms of square miles. It’s calculated by dividing the total population by the area in square miles (the area in km² converted to mi²). This gives a perspective on population density in a unit commonly used in countries like the United States.
In the chart below, we see a comparison of population densities in these cities, visualized for both square kilometers and square miles. The chart provides a clear visual representation of how density values differ between the two units of measurement.
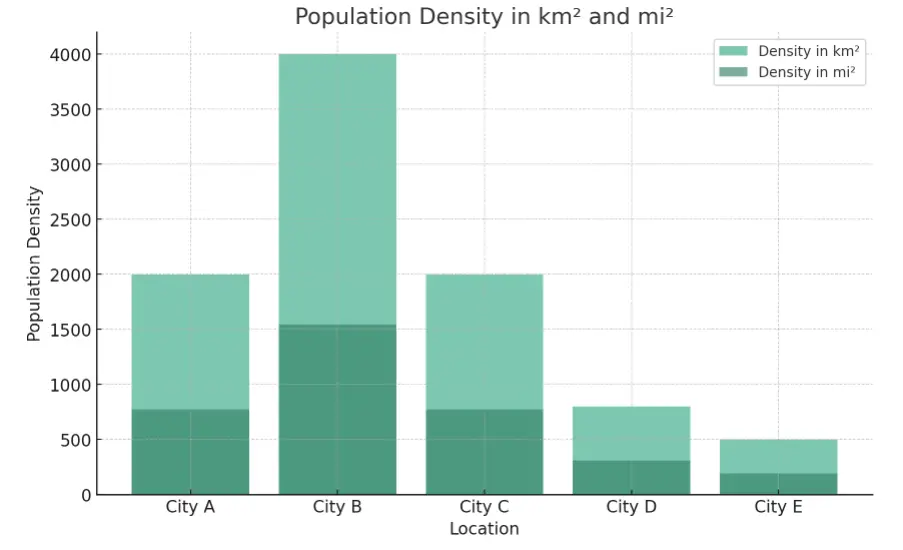
Chart Explanation:
The chart provides a visual comparison of the population densities in the five cities, depicted in both square kilometers and square miles. The key points to note are:
- Bar Representation: Each city is represented by two bars – one for density in km² and the other for mi². This dual representation allows for an easy comparison between the two units of measurement.
- X-Axis (Location): The horizontal axis of the chart lists the cities. This axis is categorical, with each category representing a different city.
- Y-Axis (Population Density): The vertical axis shows the population density values. The scale is numerical and accommodates the range of density values from our calculations.
- Color and Transparency: The bars are slightly transparent to allow for better visual comparison where they overlap.
Insights from the Population Density Data:
- Relative Density: The chart visually demonstrates how the population density in people per square kilometer is much higher than the density in people per square mile. This is due to the difference in the size of the units (1 km² is much smaller than 1 mi²).
- Comparison Across Cities: By looking at the chart, we can quickly ascertain which cities are more densely populated. For example, City B appears to have the highest population density, regardless of the unit of measure.
- Unit Conversion Impact: The table and chart together highlight the impact of unit conversion on population density figures. Although the actual number of people and area size doesn’t change, the perceived density varies significantly with the unit of measure.
In summary, this analysis provides a clear and comparative visualization of population densities in different units, offering insights into urban planning, resource allocation, and the understanding of urban spaces.
FAQ Section
Q: Why is population density important?
A: Population density is vital for understanding the spatial distribution of populations, which impacts resource allocation, infrastructure development, and environmental management.
Q: Can this calculator be used for any area size?
A: Yes, as long as the area is input in square kilometers, this calculator can be used for any geographical size.
Q: How can population density affect urban planning?
A: High population density can indicate a need for more housing, transportation, and services, while low density might highlight underutilization of space or lack of accessibility to amenities.
By using the Population Density Calculator, individuals and professionals can gain valuable insights into demographic distributions, aiding in better decision-making for community planning and development.
Additional Online Resources about Population Density
For trustworthy online sources on population density studies, you can explore the following:
- Nature – High resolution global gridded data for use in population studies: This source from Nature provides comprehensive information on the methods used to create high-resolution datasets that are essential for population studies. It includes detailed discussions on topography, country identification, and country area grids, which are crucial for understanding and analyzing population densities. You can access this resource here.
- United Nations – World Population Prospects: The United Nations offers the World Population Prospects report, which is an extensive collection of population estimates and projections. This report includes data from 1950 to the present for numerous countries, offering a valuable resource for understanding global population trends and densities. The data is available in various formats, including Excel and CSV, making it accessible for different types of analyses. You can find this resource here.
These sources are highly reputable and provide a wealth of data and analytical tools for anyone interested in population density and related demographic studies.