

The T-Statistic Calculator is an indispensable tool for statisticians, researchers, and students. It simplifies the process of calculating the t-value, a critical element in hypothesis testing and statistical analysis. By inputting the sample mean, population mean, standard deviation, and sample size, users can effortlessly determine the t-value for their data set.
T-Statistic Calculator – Instantly Compute Hypothesis Test Results
Moreover, this calculator is versatile enough to compute the sample mean, population mean, standard deviation, and sample size, provided the other values are known. This functionality makes it a valuable asset in various fields, including psychology, biology, economics, and more, where understanding differences between groups is essential.
Report an issue
Spotted a wrong result, broken field, or typo? Tell us below and we’ll fix it fast.
How to Use the T-Statistic Calculator
Using the T-Statistic Calculator is straightforward. Start by inputting the necessary values: the sample mean (average of your sample data), the population mean (average of the entire population), the standard deviation (a measure of the amount of variation or dispersion in a set of values), and the sample size (the number of observations in your sample).
Once these values are entered, click on the ‘Calculate T-Value’ button. The calculator will then compute the t-value, which is displayed in the ‘Result’ section. If you need to perform another calculation, simply click the ‘Reset’ button to clear all fields and start over.
Explaining the T-Statistic Formula
The formula for calculating the t-value in a T-Statistic Calculator is:
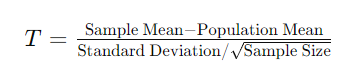
This formula is pivotal in hypothesis testing, particularly in determining whether there is a significant difference between two groups. The numerator represents the difference between the sample mean and the population mean, providing an estimate of the deviation of the sample from the population.
The denominator adjusts this difference for the size of the sample, with standard deviation providing a measure of spread or variability in the data. The square root of the sample size is used to scale the standard deviation accordingly.
Step-by-Step Calculation Guide for T-Statistic Calculator
Let’s go through an example to understand how to use the T-Statistic Calculator:
- Sample Mean (X̄): Suppose you have a sample mean of 50.
- Population Mean (μ): Assume the population mean is 45.
- Standard Deviation (σ): Let’s say the standard deviation is 5.
- Sample Size (n): Consider your sample size is 30.
Enter these values into the calculator:
- Sample Mean = 50
- Population Mean = 45
- Standard Deviation = 5
- Sample Size = 30
Click ‘Calculate T-Value’. The calculator will perform the computation and display the t-value.
Definition and Background of the T-Statistic Calculator
The t-statistic, often referred to as the t-value, is a type of standardized test statistic used in hypothesis testing, specifically in t-tests. It enables statisticians and researchers to determine if there is a significant difference between two groups that are being compared. The t-statistic is particularly useful when dealing with small sample sizes or when the population standard deviation is unknown.
Originating from the work of William Sealy Gosset under the pseudonym ‘Student’ in 1908, the t-statistic is foundational in the field of inferential statistics. It allows for the analysis of data where the central limit theorem might not strictly apply, such as in smaller samples.
The t-statistic compares the mean of the sample data to the mean of the population data, normalized by the standard deviation of the sample data. Its value helps in determining the probability of observing such a mean difference under the null hypothesis, which posits that there is no significant difference between the groups.
The t-statistic is widely used in various scientific fields. In psychology, it helps in understanding behavioral differences between groups. In medicine, it aids in comparing the effects of different treatments. In economics, it’s used to analyze the impact of policy changes or economic factors. Understanding and calculating the t-statistic is crucial for accurate data interpretation and making informed decisions based on statistical evidence.
Table of Example Calculations for T-Statistic Calculator
Below is a table demonstrating various scenarios where the t-statistic is used. Each example includes different values for sample mean, population mean, standard deviation, and sample size.
| Sample Mean | Population Mean | Standard Deviation | Sample Size | T-Value |
|---|---|---|---|---|
| 50 | 45 | 5 | 30 | 3.87 |
| 75 | 70 | 10 | 50 | 3.54 |
| 60 | 55 | 8 | 25 | 2.37 |
| 100 | 95 | 15 | 40 | 2.11 |
| 85 | 80 | 12 | 35 | 2.65 |
In the first example, a sample mean of 50, compared to a population mean of 45, with a standard deviation of 5 and a sample size of 30, yields a t-value of 3.87. This high t-value indicates a significant difference between the sample and the population means.
Glossary for T-Statistic
- T-Value: A measure used in statistical analysis to determine the significance of the difference between two groups.
- Sample Mean (X̄): The average value of a sample.
- Population Mean (μ): The average value of a population.
- Standard Deviation (σ): A measure of the amount of variation or dispersion in a set of values.
- Sample Size (n): The number of observations in a sample.
- Null Hypothesis: A hypothesis that there is no effect or no difference, used as a starting point for statistical testing.
- T-Test: A statistical test that uses the t-statistic to compare the means of two groups.
T-Statistic Calculator FAQ Section:
- What is a T-Statistic Calculator used for? A T-Statistic Calculator is used to calculate the t-value, which helps determine the significance of the difference between a sample mean and a population mean.
- Can the T-Statistic Calculator handle small sample sizes? Yes, the t-statistic is particularly useful for small sample sizes, where it provides a reliable method for hypothesis testing.
- Is the T-Statistic Calculator only used in scientific research? While commonly used in scientific research, the T-Statistic Calculator is also applicable in various other fields like economics, psychology, and medicine.
- How accurate is the T-Statistic Calculator? The accuracy of the T-Statistic Calculator depends on the accuracy of the input values (sample mean, population mean, standard deviation, and sample size).
- Can the T-Statistic Calculator determine the population mean? Yes, provided the other values (sample mean, standard deviation, sample size, and t-value) are known, the calculator can compute the population mean.
By understanding and utilizing the T-Statistic Calculator, users can make more informed decisions and interpretations in their respective fields, leveraging the power of statistical analysis to validate or challenge hypotheses and theories.
Additional Online Resources about T-statistic Calculator Topic
Here are some online resources that offer comprehensive information and guides on using T-Statistic Calculators, including how to calculate t-statistics and interpret the results:
Certainly, here are the hyperlinked resources for further exploration:
- Omnicalculator’s T-Statistic Calculator – This resource includes a detailed explanation of the t-statistic formula, instructions for using the calculator, an example calculation, and historical context of the Student’s t-distribution.
- Calculatorway’s T-Statistic Calculator – Offers a user-friendly calculator for computing the t-statistic, along with a clear explanation of the formula, step-by-step calculation instructions, and an example.
- Mathportal’s T-Test Calculator – Provides a calculator to compare dataset means against hypothetical means, with instructions on data input and test parameters.
- Leadquizzes’ Guide on T-Tests – Explains different types of t-tests and their formulas. It outlines steps to conduct a two-sample t-test, including calculating the t-statistic and critical value.
These resources should provide you with a comprehensive understanding of the t-statistic and how to calculate it using online tools.